The Worst Malinvestment

First Trust Monday Morning Outlook

Brian S. Wesbury - Chief Economist

Robert Stein, CFA - Dep. Chief Economist

April 29, 2024

Austrian Economics argues that growth comes from innovation and entrepreneurship, with “the market” directing resources to areas of the economy that provide the greatest returns. It also observes that when government uses interest rates, subsidies, taxes, or other types of market interference, it can cause “malinvestment” – or investment in areas that wouldn’t receive market support. This leads to losses and wasted resources.

While there are many examples of this as government has become bigger and more unaccountable, recent events on many college campuses around the US show some of the worst malinvestment our country experiences year in and year out.

Public universities certainly don’t run like capitalist institutions, but neither do private colleges (like the Ivy League). While people complain about all kinds of corporate welfare, what about university welfare? The eight Ivy League Schools, plus Northwestern and Stanford (all private) received $33.1 billion in grants and contracts from the federal government between 2018 and 2022 in data calculated by Open the Books.

Meanwhile, the government has given $1.6 trillion in “loans” to young people to buy the “services” of schools and their academics. Although these loans are sold as a good thing for young people, we think the main effect is to create jobs for and support the wages of academics who get to pocket the money whether their work leads to new inventions and innovation or a disdain for freedom, capitalism, and America itself.

Yes, it’s certainly true that most people with high-paying jobs have gone to college. But, as George Mason economist Bryan Caplan found, a college degree isn’t actually the cause. They earn more because they’re often highly intelligent, very conscientious, or willing to conform to a corporate culture. Sometimes all three! So unless you’re pursuing a degree in something where you need a specific body of knowledge, like medicine or engineering, going to college likely just signals natural intelligence, conscientiousness, and corporate conformity, not important knowledge.

In turn, Preston Cooper at FREOPP.org has researched about 30,000 bachelor’s programs around the country and found that more than 25% of programs experience a negative return on investment (ROI), which certainly helps explain why so many people feel burdened by student loans. And, going to a very selective school is no guarantee of a positive ROI.

We can’t help but wonder if these economic realities, and evidence of malinvestment, aren’t at least partly responsible for turmoil on college campuses. After all, malinvestment leads to slower long-term economic growth, which undermines growth in living standards. More debt and less growth are a recipe for bad outcomes.

We aren’t positive everyone will see it this way, but the data and reality on the ground seem to be saying the US ought to find a way to separate academia and government. One key item, which we have mentioned before, is that universities and colleges should be on the hook for all, or at least a portion, of unpaid student loans. And why does the federal government give billions to schools who have massive and un-taxed endowments? Any action, which reduces malinvestment, will lead to better outcomes for all.

The attached information was developed by First Trust, an independent third party. The opinions are of the listed authors at First Trust Advisors L.P, and are independent from and not necessarily those of RJFS or Raymond James.  All investments are subject to risk. There is no guarantee that these statements, opinions, or forecasts provided in the attached article will prove to be correct. Individual investor's results will vary. Past performance does not guarantee future results. Forward looking data is subject to change at any time and there is no assurance that projections will be realized. Any information provided is for informational purposes only and does not constitute a recommendation. Investing involves risk and you may incur a profit or loss regardless of strategy selected.

April Market Review

April 30, 2024

Dear Friends and Clients,

In April, the S&P 500 experienced its first 5% pullback since October 2023. This wasn’t surprising since the market had advanced over 25% from then and investors were brimming with optimism about future stock market gains. With bullish sentiment tempered, attention should focus on earnings results to re-assert the market’s upward momentum. 

Raymond James Chief Investment Officer Larry Adam is constructive on the market, saying: “While the scope of scenarios for Federal Reserve (Fed) rate cuts has contracted, accelerating earnings and a still healthy economy should support the market going forward.” 

Most sectors were down for the month with energy outperforming because of increases in oil prices related to unrest in the Middle East and with utilities outperforming due to their defensive characteristics. Technology underperformed the S&P 500. However, the earnings outlook for technology companies remains positive. The worst performer was real estate, no surprise since it’s the most interest rate-sensitive sector.

Bond yields rose to year-to-date highs as expectations for Fed rate cuts have been delayed due to persistent inflation and stronger-than-expected growth. And on the international front, central banks in Europe and the U.K. are looking more likely to cut interest rates if their rising unemployment remains under control, thanks in part to their lower Consumer Price Index (CPI), which doesn’t factor in housing costs as heavily as the U.S.

Before we move ahead, let’s take a look at the year-to-date results:

Steady growth expected to continue

U.S. real Gross Domestic Product (GDP) came in lower than expected at 1.6% quarter over quarter, annualized, but has the potential to climb higher throughout the year in the subsequent revisions as the Bureau of Economic Analysis collects more robust data on the performance of the economy. The CPI spooked markets for a third consecutive time to cap a stronger than expected first quarter for U.S. inflation, sending markets down and analysts back to the drawing table to try to figure out how many, or if any, rate cuts are now expected during the year. U.S. retail and food services sales were stronger than expected in March as employment and income growth continue to drive demand. Housing was a mixed bag, with existing home sales down while new home sales regained lost momentum from February.

Equities facing a short-term bounce

Ongoing inflation pressure led to a reset in Fed expectations and higher bond yields, causing the S&P 500 to pull back -4.1%, the Nasdaq -4.4% and the Russell 2000 -7.1% for the month. But this is expected with the market having gotten ahead of itself by rising 28% in just five months. Inflation should still be on its way down, albeit on a bumpier path than perhaps expected. Short-term indicators suggest that we are due for a brief slowdown, but with conditions allowing for recovery to a stronger market overall throughout the next 12 months. Upcoming Q1 earnings reports and bond yields will serve as indicators of what’s to come.

Large caps outperform amid higher yields

Fear of inflation, as well as unrest in the Middle East, increased equity volatility in April with the S&P 500 falling below the 50-day moving average. Energy, utilities and consumer staples outperformed while real estate, consumer discretionary and technology sectors fell short. Small cap companies underperformed their large cap counterparts largely driven by the move to higher yields.

Expected rate cuts less likely

Fears of reaccelerating inflation have called into question whether the Fed will make good on its promise to cut interest rates throughout the year, with some worried that it may even go in the opposite direction and raise interest rates should inflation rise. The expectation of five cuts in 2024 back in January had dwindled to three by March and is now at two or fewer based on Fed funds futures trading. These trends have consequently increased Treasury yields, with interest rates increasing roughly 50 basis points on durations of five years and beyond.

Amid two wars, oil prices are near six-month highs

In addition to the Russia-Ukraine war, which involved drone strikes on Russian refineries in March, Israel’s war in Gaza has also increased the risk premium in oil prices. In April, Israel’s airstrike on the Iranian consulate in Syria was met with Iran’s first-ever direct missile attack against Israeli territory, though both sides are refraining from all-out war. Such geopolitical unrest has contributed to the near six-month highs in oil prices observed at the end of April, unwelcome news ahead of the summer driving season that is unlikely to subside in the absence of a durable ceasefire.

TikTok faces ban as U.S. strengthens trade stance against China

As part of a $95 billion aid package signed by President Biden in April to assist Ukraine, Israel and Taiwan, a provision was enacted that will require popular social media platform TikTok to divest from ByteDance, its Chinese parent company, within the next 12 months or face a permanent ban on U.S. operations. It is expected that China will not allow divestment and therefore it is increasingly possible that TikTok will no longer operate in the U.S. by mid-2025. This move comes during a period when the U.S. is taking a more assertive stance against China on tech and trade policy, which could soon involve tariffs on items sensitive to national security issues like semiconductors, solar technology and electric vehicles.

Europe predicting rate cuts with U.K. likely to follow

Considering economic data and events in the Middle East, many investors have been skeptical that the central banks in Europe will cut interest rates as previously indicated. However, bank leaders have remained optimistic and, partly resulting from their confidence, European sovereign bonds have not seen the same rise in yield as their U.S. counterparts. Senior officials at the European Central Bank have signaled strongly that subdued inflationary pressures, if sustained, will allow for a rate cut as soon as June.

In the U.K., the equity index hit a new all-time high after Bank of England Governor Andrew Bailey implied the likelihood of following in their European counterpart’s decision to cut interest rates in the coming months. However, there is still ambiguity regarding that decision, which could prove sensitive to factors such as private sector wage growth, which remains higher than the central bank would like.

When comparing CPI in Europe to that of the U.S., it’s important to consider that the stickiness of domestic inflation and higher CPI in the U.S. is largely the result of the much higher weighting of housing costs, which have risen faster than other prices that contribute to the overall calculation. It should be noted that in Europe, owner-occupier housing costs are not included at all.

The bottom line

With uncertainty regarding inflation, the Fed and international conflicts, there are significant risk factors at play. However, statistics seem to point toward a positive upswing in the markets over the course of the next 12 months. And despite the first 5% pullback in the S&P 500 in six months, our outlook continues to be positive in the long term.

We’re glad to be able to bring you these updates and hope you find them helpful. Your financial goals are always top of mind, so please don’t hesitate to reach out regarding any questions or concerns you may have.

Sincerely,

Investing involves risk, and investors may incur a profit or a loss. All expressions of opinion reflect the judgment of the Raymond James Chief Investment Officer and are subject to change. There is no assurance the trends mentioned will continue or that the forecasts discussed will be realized. Past performance may not be indicative of future results. Economic and market conditions are subject to change. The Dow Jones Industrial Average is an unmanaged index of 30 widely held stocks. The NASDAQ Composite Index is an unmanaged index of all common stocks listed on the NASDAQ National Stock Market. The S&P 500 is an unmanaged index of 500 widely held stocks. The MSCI EAFE (Europe, Australasia and Far East) index is an unmanaged index that is generally considered representative of the international stock market. The Russell 2000 is an unmanaged index of small-cap securities. The Bloomberg Barclays US Aggregate Bond Index is a broad-based flagship benchmark that measures the investment grade, U.S. dollar-denominated, fixed-rate taxable bond market. An investment cannot be made in these indexes. The performance mentioned does not include fees and charges, which would reduce an investor’s returns. Investing in the energy sector involves special risks, including the potential adverse effects of state and federal regulation, and may not be suitable for all investors. A credit rating of a security is not a recommendation to buy, sell or hold the security and may be subject to review, revision, suspension, reduction or withdrawal at any time by the assigning Rating Agency.  Bond prices and yields are subject to change based upon market conditions and availability. If bonds are sold prior to maturity, you may receive more or less than your initial investment. Income from municipal bonds is not subject to federal income taxation; however, it may be subject to state and local taxes and, for certain investors, to the alternative minimum tax. Income from taxable municipal bonds is subject to federal income taxation, and it may be subject to state and local taxes. Investing in commodities is generally considered speculative because of the significant potential for investment loss. Their markets are likely to be volatile and there may be sharp price fluctuations even during periods when prices overall are rising. International investing involves special risks, including currency fluctuations, differing financial accounting standards, and possible political and economic volatility. The companies engaged in the communications and technology industries are subject to fierce competition and their products and services may be subject to rapid obsolescence. The Consumer Price Index is a measure of inflation compiled by the US Bureau of Labor Studies. The Leading Economic Index (LEI) provides an early indication of significant turning points in the business cycle and where the economy is heading in the near term.

Material created by Raymond James for use by its advisors.

Fed’s Inflation Calculations Explained

Three on Thursday First Trust Economics

Brian S. Wesbury - Chief Economist

April 18, 2024

In this week’s “Three on Thursday,” we explore the Personal Consumption Expenditures (PCE) Price Index, which became the Federal Reserve’s preferred inflation gauge starting in 2000. This shift occurred after Federal Reserve Chairman Alan Greenspan highlighted its advantages in The Monetary Policy Report to Congress. The Fed favors the PCE Price Index over the Consumer Price Index (CPI) for several reasons. Firstly, the PCE Price Index uses a formula that adapts to changes in spending habits, reducing the upward bias inherent in the CPI’s fixed-weight approach. It also employs weights based on a broader expenditure measure. Additionally, the PCE Price Index’s historical data can be revised to incorporate new information and improvements in measurement techniques, which include refinements to the source data used in the CPI, leading to a more consistent time series. While the Federal Open Market Committee (FOMC) has adopted the PCE as its preferred measure, it continues to use a range of price metrics and other cost information to assess inflation trends. For further clarity, we’ve included a table and two detailed charts in this edition.

The PCE Price Index can be divided into two main categories: Goods and Services. Goods represent 33.1% of the index, with Durable Goods (items intended to last three years or more such as appliances and furniture), and Nondurable Goods (items with a shorter lifespan, like food and clothing) contributing 11.6% and 21.4% to the overall index, respectively (off 0.1% due to rounding). Services account for 66.9% of the index, dominated by Household Consumption Expenditures, which hold a substantial 64.0% weighting. Nonprofits contribute a smaller portion at 2.9%. Within Household Consumption Expenditures, Housing and Utilities form the largest group, influencing the overall index with a 17.7% weighting, followed closely by Health Care at 16.3%.

Since 2000, the annualized gain in the PCE Price Index has typically been about 0.4 percentage points lower than the CPI due to several key differences. First, the CPI uses a fixed basket of goods and services with quantities based on past consumption, rarely updating. In contrast, the PCE Price Index adapts more dynamically, reflecting changes in consumer behavior and substitutions in response to price changes by frequently adjusting item weights based on current spending data. Second, consumption categories in the CPI and PCE are weighted differently; for instance, housing accounts for about 45% of the CPI but only 15.4% of the PCE. Third, the CPI measures direct out-of-pocket expenses by consumers, while the PCE includes all goods and services consumed by households, even those paid by employers and the government, like medical premium payments made by employers, providing a broader view of consumption. Lastly, variations in seasonal adjustments and price calculations for identical products also contribute to discrepancies. For example, the PCE’s airline fare index is based on passenger revenue and miles traveled, whereas the CPI measures ticket prices for specific routes, leading to different pricing insights.

For decades, economists have excluded food and energy prices from inflation measures – commonly referred to as “core prices” – because they can be both seasonal and volatile. Starting in November 2022, the Federal Reserve said it will focus on a narrower measure known as “Supercore” inflation, which refines this perspective even further. Fed economists categorize core inflation into three segments: core goods, housing services, and core services minus housing. The latter category, often referred to as Supercore, gained traction after the COVID lockdowns. This focus stems from the Fed’s belief that service sector prices, unlike goods prices, are predominantly influenced by labor costs—a factor the Fed thinks it can influence. Raising interest rates typically cools economic activity, and jobs growth, which should limit wage hikes. In contrast, they believe goods prices are more susceptible to global dynamics like supply chain variations. Interestingly, in spite of major interest rates hikes, Supercore has remained stubbornly elevated, up 3.3% from a year ago. This is likely a significant argument for fewer rate cuts this year than the market has been expecting.

The attached information was developed by First Trust, an independent third party. The opinions are of the listed authors at First Trust Advisors L.P, and are independent from and not necessarily those of RJFS or Raymond James.  All investments are subject to risk. There is no guarantee that these statements, opinions, or forecasts provided in the attached article will prove to be correct. Individual investor's results will vary. Past performance does not guarantee future results. Forward looking data is subject to change at any time and there is no assurance that projections will be realized. Any information provided is for informational purposes only and does not constitute a recommendation. Investing involves risk and you may incur a profit or loss regardless of strategy selected.

Continued Growth in Q1

First Trust Monday Morning Outlook

Brian S. Wesbury - Chief Economist

Robert Stein, CFA - Dep. Chief Economist

April 22, 2024

The economy continued to grow in the first quarter at what we estimate is a 2.6% annual rate. That’s a slowdown from the 3.1% rate in 2023, but still good compared to the past couple of decades when the average growth rate has been 2.0%.

However, we think a chunk of recent growth is artificial, and temporary, the by-product of too much government. Directly, this includes “real” (inflation-adjusted) government purchases that grew 4.6% in 2023 and we estimate grew at a 2.3% annual rate in the first quarter.

It also includes the indirect effects of the expansion in the budget deficit in FY 2023. The official deficit didn’t expand much, but that’s because President Biden announced a plan to forgive student loans in 2022 and then the Supreme Court struck it down in 2023. Neither of these affected the government’s cash flow but they did change official government accounting. Taking them out means the deficit expanded to 7.5% of GDP in FY 2023 from 3.9% in FY 2022.

In addition, and as we explained recently (MMO, April 8), if monetary policy were really tight, inflation would be persistently declining. But CPI prices were up 3.0% in the year ending in June 2023 and are now up 3.5% in the past year. This suggests residual effects of past monetary looseness are still boosting the economy.

We estimate that Real GDP expanded at a 2.6% annual rate in the first quarter, mostly accounted for by an increase in consumer spending.

Consumption: “Real” (inflation-adjusted) retail sales outside the auto sector declined at a 3.0% annual rate in Q1 while auto sales declined at an 8.7% rate. However, it looks like real services, which makes up most of consumer spending, soared at a 4.7% pace. That’s the fastest pace for service growth since the re-opening from COVID in 2020-21. Excluding that re-opening, when all the data were whacky, it's the fastest pace for service growth since the peak of the Internet Bubble in 2000. Putting it all together, we estimate that real consumer spending on goods and services, combined, increased at a 3.1% rate, adding 2.1 points to the real GDP growth rate (3.1 times the consumption share of GDP, which is 68%, equals 2.1).

Business Investment: We estimate a 2.4% growth rate for business investment, with gains in intellectual property leading the way, while commercial construction declined. A 2.4% growth rate would add 0.3 points to real GDP growth. (2.4 times the 14% business investment share of GDP equals 0.3).

Home Building: Residential construction is showing some resilience in spite of some lingering pain from higher mortgage rates. Home building looks like it grew at a 5.0% rate, which would add 0.2 points to real GDP growth. (5.0 times the 4% residential construction share of GDP equals 0.2).

Government: Only direct government purchases of goods and services (not transfer payments) count when calculating GDP. We estimate these purchases were up at a 2.3% rate in Q1, which would add 0.4 points to the GDP growth rate (2.3 times the 17% government purchase share of GDP equals 0.4).

Trade: Looks like the trade deficit expanded in Q1, as exports grew but imports grew even faster. In government accounting, a larger trade deficit means slower growth, even if exports and imports both grew. We’re projecting net exports will subtract 0.5 points from real GDP growth.

Inventories: Inventory accumulation looks like it picked up in Q1, but only slightly versus Q4, translating into what we estimate will be a 0.1 point addition to the growth rate of real GDP.

Add it all up, and we get a 2.6% annual real GDP growth rate for the first quarter. Solid for now, but we expect slower growth later this year as the temporary effects of government deficit spending wear off.

The attached information was developed by First Trust, an independent third party. The opinions are of the listed authors at First Trust Advisors L.P, and are independent from and not necessarily those of RJFS or Raymond James.  All investments are subject to risk. There is no guarantee that these statements, opinions, or forecasts provided in the attached article will prove to be correct. Individual investor's results will vary. Past performance does not guarantee future results. Forward looking data is subject to change at any time and there is no assurance that projections will be realized. Any information provided is for informational purposes only and does not constitute a recommendation. Investing involves risk and you may incur a profit or loss regardless of strategy selected.

Elections Matter

First Trust Monday Morning Outlook

Brian S. Wesbury - Chief Economist

Robert Stein, CFA - Dep. Chief Economist

April 15, 2024

Many, us included, see parallels between today’s big issues and those of the 1960s and 1970s. Mistakes in both geopolitical and fiscal policies compound overtime, often leading to more mistakes. After Vietnam ended badly, US weakness likely encouraged terrorism. The 1972 Munich Massacre of Israel Olympic Athletes, Entebbe in 1976, and finally US hostages held in Iran from 1979 to 1981.

At the same time both fiscal and monetary policy became unhinged. The result was stagflation, with inflation hitting and unemployment approaching double digits. We don’t have room for a complete historical explanation, but Presidents Johnson, Nixon, Ford, and Carter each made mistakes in either foreign or fiscal policy that led to these problems.

Then, Ronald Reagan was elected, and while his opponents claimed he would cause nuclear war, the exact opposite happened. Stagflation was ended, the Berlin wall fell, and the world entered a mostly peaceful era. Elections matter.

With Iran attacking Israel over the weekend, and unsustainable budget deficits eroding the US fiscal situation, we are reminded of the 1970s. In fact, there were two decisions made under President Carter almost fifty years ago that have helped create both of these issues.

We focus on policy, not personality. We are not attacking President Carter himself. He appears to be a very good and decent man. His great charitable work after leaving the presidency speaks for itself and sets a great standard for other former officeholders. In addition, President Carter bucked his party and deregulated both the trucking and airline industries.

However, Carter also made some serious blunders. On the geopolitical front, it was Carter who decided (1) not to back the Shah of Iran in 1978 and after that (2) not to pursue regime change in Iran after the seizure of American hostages and a coup d’état against the duly-elected Iranian President Banisadr (who had to flee for his life back to France).

Now the Islamic Republic of Iran effectively controls Syria, much of Iraq, Lebanon, Gaza, some of Yemen, and in the meantime is aligning with rivals of the US, such as China and Russia. With every passing decade it has become more difficult to dislodge the regime in Iran and now, in the absence of a change in the near future, it may only be a matter of time before Iran is able to acquire a nuclear weapon.

On the fiscal side, President Carter also championed an arcane but incredibly important change to Social Security enacted in 1977. This change virtually guaranteed the long-term insolvency of the old-age pension portion of the Social Security system unless future policymakers agree to some combination of tax hikes or benefit cuts.

Before these changes were made, Social Security payments were adjusted by inflation, what we call the cost-of-living adjustment (COLA). Until the mid-1970s, Congress had to vote to make this adjustment and politicians took credit every time they did. But, as inflation became more of a problem, the annual COLA was tied directly to the Consumer Price Index.

The COLA adjustment automatically increased both current and future benefits. But Carter added a wrinkle. Current recipients would receive the COLA adjustment, but future benefits would rise by both the COLA plus an estimate of real wage gains. At first this made little difference, but through the magic of compounding, this adjustment for real wages adds up and the current trajectory of payments is unsustainable.

Carter and other policymakers were warned about this problem at the time, but didn’t pay it heed. No wonder people see similarities between today and the 1970s. Current policies and past policies are colliding to create the very same problems. As November approaches, voters would do well to remember this history. Their decisions are not just about the next few years, but will resonate for decades to come. Solid US leadership can change the entire world.

The attached information was developed by First Trust, an independent third party. The opinions are of the listed authors at First Trust Advisors L.P, and are independent from and not necessarily those of RJFS or Raymond James.  All investments are subject to risk. There is no guarantee that these statements, opinions, or forecasts provided in the attached article will prove to be correct. Individual investor's results will vary. Past performance does not guarantee future results. Forward looking data is subject to change at any time and there is no assurance that projections will be realized. Any information provided is for informational purposes only and does not constitute a recommendation. Investing involves risk and you may incur a profit or loss regardless of strategy selected.

Is the Fed Tight, or Not?

First Trust Monday Morning Outlook

Brian S. Wesbury - Chief Economist

Robert Stein, CFA - Dep. Chief Economist

April 8, 2024

In the waning seconds of one of the most watched women’s college basketball games ever, a foul was called. The University of Connecticut was playing the University of Iowa in the semifinals of the women’s NCAA championship tournament. Officials called a UConn player for an “illegal screen” on an Iowa defender, which helped Iowa win the game. This happened Friday night, and on X (formerly Twitter) the debate about this call still rages.

In spite of the debate, that game is over. On Sunday, Iowa lost to South Carolina in the finals and the world moves on. Meanwhile, in the realm of economics, a different debate rages. Is Federal Reserve policy tight, or not?

Ultimately, there is an ironclad two-part test to determine if monetary policy is tight. First, has the economy weakened to below trend growth? More clearly, is GDP falling, or unemployment rising? And second, has inflation persistently declined. If those things haven’t happened, it's hard to argue monetary policy has been tight.

At present, we are tracking Real GDP growth at about a 2.0% annual rate in the first quarter, which is close to the long-term average. This follows all of 2023, and the last two quarters of 2022, where quarterly real economic growth was faster than 2.0% each and every quarter. At the same time, unemployment remains below 4.0%. In other words, we haven’t yet had an economic slump consistent with tight money.

For inflation – after dropping from what appears to be a supply-chain induced spike of about 9.0% in mid-2022 – CPI inflation fell to 3.1% in mid-2023. But lately, CPI inflation has stopped its decline. We estimate that consumer prices rose 0.3% in March and the Cleveland Fed’s CPI Nowcast currently projects 0.3% for April, as well. If so, the overall CPI will be up 3.3% in April versus the year prior.

So, both real growth and inflation show little impact from Fed tightening, in spite of many of the traditional measures of monetary policy signaling tightness. For example, the M2 measure of the money supply peaked in April 2022 and is down 4.3% since. We haven’t had a drop like that since the early 1930s during the Great Depression. Yes, the monetary base is up 10.7% in the past year, but unless that base money is converted into M2, it likely has little impact. Following the 2008-09 financial crisis, quantitative easing didn’t turn into M2 and inflation remained tame…but during COVID, QE did cause M2 to spike, and inflation jumped.

Meanwhile the slope of the yield curve between the target federal funds rate and the 10-year Treasury yield has been inverted since late 2022, a typical sign of tight money. And while not as clear cut, the federal funds rate has been 2.0 percentage points, or more, above inflation in the past six months. While we would say these rates are roughly neutral, not really helping or hurting growth, this is a huge change from the 2009-2021 period, when rates were held well below inflation.

Think of it this way: imagine you’re trying to freeze water, at sea level. A thermometer shows the temperature is 25⁰F and the water isn’t freezing. Does this mean the laws of chemistry and physics have been repealed? Of course not! Any sensible person would think that the thermometer must be broken, or maybe the liquid you’re trying to freeze isn’t water after all.

Which brings us to one signal of monetary tightness that hasn’t been triggered yet. History suggests that interest rates should be roughly equal to “nominal” GDP growth (real GDP growth plus inflation) – a cousin to what is called the “Taylor Rule.” Nominal GDP is up 5.9% in the past year and a 6.5% annual rate in the past two years. Yet, the federal funds rate is just 5.4%. That’s not tight money! Maybe that’s the measure of tightness we should have been following all along.

In other words, maybe one of the reasons we haven’t yet experienced economic turbulence is that monetary policy hasn’t been as tight as most investors thought. If so, it could take much longer to bring inflation down to 2.0% than the Fed expects, which means short-term rates could stay much higher for much longer.

In turn, that would mean more economic pain ahead than most investors currently expect. Some calls are hard to make no matter how much time is left in the game.

The attached information was developed by First Trust, an independent third party. The opinions are of the listed authors at First Trust Advisors L.P, and are independent from and not necessarily those of RJFS or Raymond James.  All investments are subject to risk. There is no guarantee that these statements, opinions, or forecasts provided in the attached article will prove to be correct. Individual investor's results will vary. Past performance does not guarantee future results. Forward looking data is subject to change at any time and there is no assurance that projections will be realized. Any information provided is for informational purposes only and does not constitute a recommendation. Investing involves risk and you may incur a profit or loss regardless of strategy selected.

The Fed Audit

First Trust Monday Morning Outlook

Brian S. Wesbury - Chief Economist

Robert Stein, CFA - Dep. Chief Economist

April 1, 2024

Several years ago some politicians started demanding that the Federal Reserve get audited. We think the idea has some merits but also some drawbacks, as well.

One problem with the Fed is that it doesn’t have a hard limit on its own spending. For example, let’s say the Fed wanted to hire a bunch of extra staff to write papers on climate change, income inequality, gun control, or other “political hot button” issues of the day that don’t really have a direct relationship with monetary policy or the Fed’s mission. Our understanding is that there’s nothing to stop the Fed from doing so, as long as it claims some relationship to monetary policy, no matter how tenuous.

And even if the appointed leaders at the Federal Reserve Board object, there are still twelve regional reserve banks around the country that could do so, and their leaders are not appointed by the president or confirmed by the Senate. In fact, the Chicago Federal Reserve Bank already has staff dedicated to researching topics that impact the “greater good” and “community development.”

Depending on the party in power, auditing the Fed could lead Congress to mandate more or less of these endeavors, and at the same time put more political pressure on the Fed to tilt monetary policy in a way that politicians see as favorable toward themselves, which would mean less Fed independence. History shows clearly that less central bank independence correlates closely with higher inflation and less currency stability.

What we would suggest is a law that limits the Fed to activities that directly, not indirectly, impact monetary policy. Those areas can be measured with an accounting audit by an outside firm, which the Fed already does. Last week the Fed released its audited financial statements for 2023 and they were…. interesting.

Most prominently, the Fed lost $114 billion last year. This is the first time the Fed has ever run an annual loss and the loss is a direct consequence of the Financial Panic of 2008 when the Fed started paying banks to hold reserves.

Prior to that change, the Fed did not pay banks to hold reserves, meanwhile earning interest on the securities in its portfolio (mostly Treasury bills). But after the change, when the Fed was holding rates close to zero, it still ran surpluses. When the Fed held rates low, it contributed an average of more than $75 billion annually to government revenue.

But holding rates too low creates distortions in financial markets and rates had to go higher. In order to “normalize” rates, the Fed now pays banks 5.4% on their excess reserves. The result is that the Fed paid private banks $281 billion in 2023.

But the Fed earns less than that on its bond portfolio. To repeat, it lost $114 billion in 2023 and has a total accumulated deficit of $133.3 billion since 2022. The Fed calls these accumulated losses a “deferred asset” because it expects to return to profitability in the future.

These kinds of losses should invite political oversight. Does the Fed just borrow more from the Treasury (the taxpayer) to meet payroll? If so, there is already a reason to doubt its independence from the political side of government. Rather than audit the Fed, which is already done, laws which require more transparency and a more focused mission, would be productive. The Fed has become too political. That should change.

The attached information was developed by First Trust, an independent third party. The opinions are of the listed authors at First Trust Advisors L.P, and are independent from and not necessarily those of RJFS or Raymond James.  All investments are subject to risk. There is no guarantee that these statements, opinions, or forecasts provided in the attached article will prove to be correct. Individual investor's results will vary. Past performance does not guarantee future results. Forward looking data is subject to change at any time and there is no assurance that projections will be realized. Any information provided is for informational purposes only and does not constitute a recommendation. Investing involves risk and you may incur a profit or loss regardless of strategy selected.

CPI Explained: Breaking Down the Basics

First Trust Three on Thursday

Brian S. Wesbury - Chief Economist

Robert Stein, CFA - Dep. Chief Economist

March 21, 2024

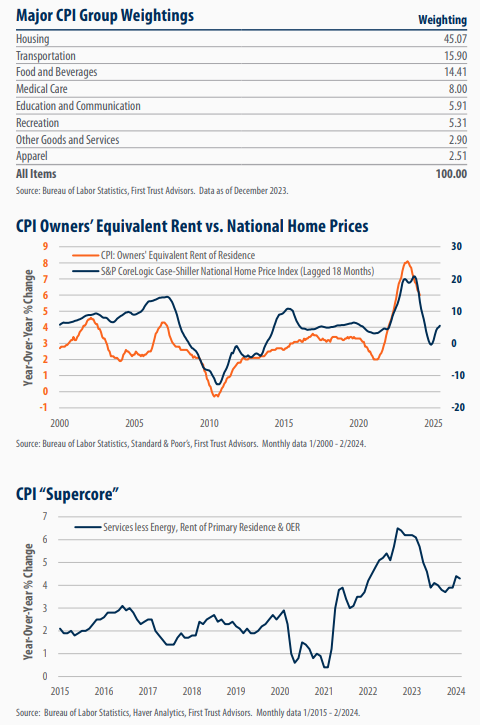
In this week’s edition of “Three on Thursday,” we take a deeper look at the Consumer Price Index (CPI). The CPI is a key measure of inflation, measuring the average change in price over time of a market basket of consumer goods and services. Its broadest and most widely used index, the Consumer Price Index for All Urban Consumers (CPI-U), represents over 90% of the U.S. urban population. The CPI-U reflects the cost of essential items such as food, apparel, housing, fuel, transportation, medical services, pharmaceuticals, and other products and services purchased for everyday living by nearly all urban residents, excluding those in rural areas, the military, and those in institutions, such as mental hospitals and prisons. Prices are collected monthly from 75 urban areas across the country from about 6,000 housing units and around 22,000 retail establishments. The CPI-U uses these prices, weighted by their importance in consumer spending, to calculate average price changes, which are then used to gauge inflation. To offer deeper insights, we’ve included three informative charts below.

The CPI-U consists of over 200 categories that are arranged into eight major groups, with weightings based on consumer spending patterns. The Bureau of Labor Statistics (BLS) calculates each category’s share of total expenditures by totaling the expenditures reported by households for each item and then determines the proportion of total expenditures that each item represents. In essence, items or categories where consumers spend a larger portion of their income will have higher weights in the CPI, indicating their greater importance in the overall index. The BLS now updates these weightings annually, using recent Consumer Expenditure Survey data to keep the CPI relevant and accurately reflect shifts in consumer spending on various goods and services. The largest group weighting by far in the CPI-U is housing which makes up 45% of the overall index weighting.

Housing, with a substantial 45% weighting, constitutes the largest share of the Consumer Price Index (CPI), with the Owner’s Equivalent Rent (OER) being its most significant component at a 26% overall weighting in the CPI. In essence, OER measures the change in the amount a homeowner would pay in rent or earn from renting his or her home in a competitive market. The investment portion that comes with purchasing a home is excluded in OER, so home prices are not factored into the estimate. This estimation is achieved through the CPI Housing Survey, which follows the rents of a large sample of renter-occupied housing units. Each month, one-sixth of a pricing area (called a panel) is measured, with all six panels priced twice a year. This methodology causes the CPI’s rent measures to lag behind market indices like Zillow and CoreLogic, particularly because the CPI captures rents for ongoing tenancies rather than just new listings, and only measures an area every six months. There is a very high correlation between home prices lagged 18 months and OER. If this relationship holds moving forward, the growth rate of OER should continue slow, putting downward pressure on the overall CPI.

Since November 2022, the Federal Reserve has honed its focus on a narrower inflation measure known as “supercore” inflation. Powell has highlighted its significance, stating that supercore inflation “may be the most important category for understanding the future evolution of core inflation.” Traditionally, core CPI excludes food and energy prices to provide a clearer view of inflation trends. The Fed’s approach to supercore inflation refines this perspective even further. Powell, along with other senior Fed officials, categorize core inflation into three segments: core goods, housing services, and core services minus housing. The latter category, often referred to as supercore, has garnered considerable attention. This focus stems from the Fed’s belief that service sector inflation, unlike goods prices, is predominantly influenced by labor costs—a factor the Fed can influence through interest rate adjustments. Raising interest rates typically cools economic activity, leading to slower hiring rates or even layoffs, thereby affecting inflation. In contrast, they believe goods prices are more susceptible to global dynamics like supply chain variations. Relative to the overall CPI, supercore has remained much more stubbornly elevated.

The attached information was developed by First Trust, an independent third party. The opinions are of the listed authors at First Trust Advisors L.P, and are independent from and not necessarily those of RJFS or Raymond James.  All investments are subject to risk. There is no guarantee that these statements, opinions, or forecasts provided in the attached article will prove to be correct. Individual investor's results will vary. Past performance does not guarantee future results. Forward looking data is subject to change at any time and there is no assurance that projections will be realized. Any information provided is for informational purposes only and does not constitute a recommendation. Investing involves risk and you may incur a profit or loss regardless of strategy selected.

Welcome to State-Run Capitalism

First Trust Monday Morning Outlook

Brian S. Wesbury - Chief Economist

Robert Stein, CFA - Dep. Chief Economist

March 25, 2024

We’ve mentioned this before, but it bears repeating. It seems that investors pay as close attention to what the government is doing, as they do to actual business news. We don’t think investors are wrong to do this, but it’s only because government has become so big.

The US has moved from a simple Keynesian-type model to what we call “State-Run Capitalism.” When the economy turns soft, a typical “Keynesian” (demand-side) response would be to boost the budget deficit or print more money.

Now, the government is running permanent, and very large, deficits and using its budget to fund semiconductors, EVs, solar and wind energy generation, as well as redistributing more money to immigrants and students who are in debt. This all smells and looks like central planning…or State-Run Capitalism.

At the same time, because the Fed is now using an abundant reserve monetary policy, it has taken the financial system out of the process of determining short-term interest rates. Banks no longer need to trade excess reserves, so the federal funds rate has no real market. The Fed just makes that rate up.

So, here we sit in 2024, and a Wall Street Journal economics reporter, Greg Ip, just wrote a piece titled “The Economy is Great…”. We don’t think that’s really true, but real GDP did grow more than 3% last year and job growth has been robust.

A typical Keynesian response to this, the one most people were taught in economics class, would be for the government to run a surplus, or at least substantially shrink the deficit, and the Fed to be at least slightly worried about over-heating the economy.

Instead, Congress just pushed through a $1.2 trillion spending bill with a deficit that will approach $1.6 trillion, and the Fed announced that it was likely to cut rates three times in 2024.

What the heck? Why? Especially with inflation reports so far in 2024 coming in hot. The Cleveland Fed median price index is up 4.6% from 12 months ago, “supercore” CPI is up 4.3% over 12 months, and nearly 7% annualized over the past three months. With inflation this high, and the economy “great,” no traditional Keynesian would support these policies.

We don’t blame investors for reading the tea leaves and realizing that all this stimulus is probably good for the markets in the short run. Lower rates mean more growth and higher price earnings ratios. The market seemingly (and perhaps correctly) has decided that the Fed, and the Federal Government, can manage the economy to keep stocks up.

But all of this will come with a price. No centrally managed economy has been permanently made to go only one way. It can look good for a time, but eventually the sheer size of the government and the mishandling of monetary policy catches up. On a smaller scale, the US tried this in the 1970s, and the result was stagflation. Russia, Venezuela, and a host of other countries have all failed.

But it doesn’t happen overnight. More importantly, because the Fed has separated the growth of the money supply and the level of interest rates, rate cuts may not mean what many people think they do. Yes, rates may come down this year, but the money supply has contracted in the past year. A contraction in the money supply is never a good sign.

We still expect a recession this year. The US will have an irresponsible deficit, but it will be slightly less irresponsible than it was last year. Add in a decline of M2, and the morphine pumped into the system over the past few years has worn off.

If the Fed is cutting rates because it is an election year, and if the government is spending money in an effort to entice some voters to see it as personally beneficial to vote for big government, it’s a recipe for lousy economic outcomes.

When the government pushes money in directions that are politically beneficial, they are often not efficient in a true economic sense. This means less growth and more inflation. We are very worried about stagflation in the years ahead.

Between now, and whenever that is, the market may completely ignore it. And, investors will think the government has found a recipe for permanent prosperity. But after thousands of years of trying, and never making it happen, we bet against even this new version of State-Run Capitalism.

The attached information was developed by First Trust, an independent third party. The opinions are of the listed authors at First Trust Advisors L.P, and are independent from and not necessarily those of RJFS or Raymond James.  All investments are subject to risk. There is no guarantee that these statements, opinions, or forecasts provided in the attached article will prove to be correct. Individual investor's results will vary. Past performance does not guarantee future results. Forward looking data is subject to change at any time and there is no assurance that projections will be realized. Any information provided is for informational purposes only and does not constitute a recommendation. Investing involves risk and you may incur a profit or loss regardless of strategy selected.

Rate Expectations

First Trust Economic Research Report

Robert Stein, CFA - Dep. Chief Economist

Brian S. Wesbury - Chief Economist

March 20, 2024

There was zero chance the Fed was going to cut rates today; instead it was all about what today’s meeting, the dot plot, and the press conference meant for the timing and pace of rate cuts in the months ahead.

Starting with today's statement, there was only one change from January, and it was a minor one. While prior language stated that job gains “have moderated since early last year but remain strong” today’s statement removed language concerning moderation and simply stated that “job gains have remained strong.” That – along with a slight adjustment lower to the unemployment rate forecast for 2024 –suggest that a stronger than anticipated job market has weakened Fed confidence that inflation will trend sustainably towards 2.0%.

The survey of economic projections provided more clarity. Forecasts for real (inflation-adjusted) GDP growth in 2024 rose to 2.1% from 1.4% in December. And with that outlook for stronger growth, their unemployment rate expectation shifted down to 4.0% from 4.1% while core inflation expectations rose to 2.6% from 2.4%. It's worth noting that with unemployment at 3.9% and core inflation at 2.8%, this suggests the FOMC members see very little movement in either category over the remaining nine months of the year.

While the combination of faster growth, higher inflation, and a stronger job market didn’t shift the Fed’s expectation for the equivalent of three 25 basis point cuts between now and year end, the distribution of forecasts shows that only one FOMC participant now expects more than three rate cuts will be appropriate this year, down from five members at the December meeting. And rate cut expectations for 2025 shifted to three cuts from four.

Beyond rate cuts, markets have been wondering when the Fed will start to taper back the pace of quantitative tightening (QT). During today’s press conference, Powell wouldn’t confirm or deny that the process could begin as soon as the next Fed statement on May 1st, but he did say that it would be appropriate to start “fairly soon” with plans to gradually cut the pace of roll-offs. In other words, May looks to be on the table.

We expect the Fed will start cutting rates in June. That said, the Fed should take a cautious approach once the process begins, with a primary focus on not cutting rates too aggressively or prematurely, which could re-ignite the inflation problem like the Fed did on multiple occasions under Chairman Arthur Burns in the 1970s. The economy is still growing, but we think it falls into recession before the year is out and that real GDP growth significantly lags the predictions of the FOMC members. This, in turn, heightens the risk that the Fed takes a more aggressive path on rate cuts in response to economic weakness, bringing the threat of reaccelerating inflation to the forefront in the years ahead.

Text of the Federal Reserve's Statement:

Recent indicators suggest that economic activity has been expanding at a solid pace. Job gains have remained strong, and the unemployment rate has remained low. Inflation has eased over the past year but remains elevated.

The Committee seeks to achieve maximum employment and inflation at the rate of 2 percent over the longer run. The Committee judges that the risks to achieving its employment and inflation goals are moving into better balance. The economic outlook is uncertain, and the Committee remains highly attentive to inflation risks.

In support of its goals, the Committee decided to maintain the target range for the federal funds rate at 5-1/4 to 5-1/2 percent. In considering any adjustments to the target range for the federal funds rate, the Committee will carefully assess incoming data, the evolving outlook, and the balance of risks. The Committee does not expect it will be appropriate to reduce the target range until it has gained greater confidence that inflation is moving sustainably toward 2 percent. In addition, the Committee will continue reducing its holdings of Treasury securities and agency debt and agency mortgage-backed securities, as described in its previously announced plans. The Committee is strongly committed to returning inflation to its 2 percent objective.

In assessing the appropriate stance of monetary policy, the Committee will continue to monitor the implications of incoming information for the economic outlook. The Committee would be prepared to adjust the stance of monetary policy as appropriate if risks emerge that could impede the attainment of the Committee's goals. The Committee's assessments will take into account a wide range of information, including readings on labor market conditions, inflation pressures and inflation expectations, and financial and international developments.

Voting for the monetary policy action were Jerome H. Powell, Chair; John C. Williams, Vice Chair; Thomas I. Barkin; Michael S. Barr; Raphael W. Bostic; Michelle W. Bowman; Lisa D. Cook; Mary C. Daly; Philip N. Jefferson; Adriana D. Kugler; Loretta J. Mester; and Christopher J. Waller.

The attached information was developed by First Trust, an independent third party. The opinions are of the listed authors at First Trust Advisors L.P, and are independent from and not necessarily those of RJFS or Raymond James.  All investments are subject to risk. There is no guarantee that these statements, opinions, or forecasts provided in the attached article will prove to be correct. Individual investor's results will vary. Past performance does not guarantee future results. Forward looking data is subject to change at any time and there is no assurance that projections will be realized. Any information provided is for informational purposes only and does not constitute a recommendation. Investing involves risk and you may incur a profit or loss regardless of strategy selected.

Focused on the Fed

First Trust Monday Morning Outlook

Brian S. Wesbury - Chief Economist

Robert Stein, CFA - Dep. Chief Economist

March 18, 2024

The Fed meets this week, which means investors and analysts will be sifting through Wednesday’s FOMC statement, updated economic projections, the “dot plots,” and Powell’s press conference searching for any signal – real or imagined – about what our central bank will do next. In particular, the market is on tenterhooks about when rate cuts will start, how fast those rate cuts will come, or if the Fed will simply hit the “pause” button on the prospect of rate cuts until deep into 2024.

We think this obsession with the Federal Reserve is unhealthy. Instead of an obsession with slight policy shifts out of Washington, DC, we think investors need to be focused on more important matters, like the process of innovation, entrepreneurial risk-taking, and corporate profits. In the end, it’s these factors that will drive stock market valuations the most, not the vagaries of the short-term interest rate target by the mandarins of money.

Things have changed a great deal since the last Fed meeting on January 31. Back then, the futures market expected about six rate cuts of 25 basis points each this year, with the first cut coming in March. As of Friday’s close, the market was expecting only three rate cuts this year, with the first one coming in either June or July.

No wonder the shift in rate expectations given recent reports on inflation. The two CPI reports since then show consumer prices up at a 4.6% annual rate in the first two months this year. And no, this was not food and energy; “core” prices, which exclude those two volatile categories were also up at a 4.6% annual rate so far this year.

Even worse for the Fed is that the newly made-up slice of the CPI that the Fed and others call the “Super Core” measure of inflation, which includes services only (no goods) but also excludes food, energy, and housing rents, rose 0.8% in January and 0.5% in February. That’s a growth rate of 8.2% annualized so far this year. Notice how you used to hear a lot about this measure a year or so ago when it was indicating lower inflation and now few dare speak its name when it shows inflation re-accelerating! Meanwhile, overall producer prices are up 5.4% so far this year and “core” producer prices are up at a 4.5% annual rate.

None of these figures are remotely close to the 2.0% inflation goal the Fed claims it’s still targeting.

The problem for the Fed is that there are signs that the economy may be slowing. Although retail sales rose 0.6% in February, after factoring in downward revisions to prior months, retail sales rose a tepid 0.1%. “Core” sales, which exclude volatile categories such as autos, building materials, and gas stations — and is a crucial measure for estimating GDP — increased by 0.1% in February, but was revised significantly lower for previous months, down 0.5%. If unchanged in March these sales will be down at a 0.7% annual rate in Q1 versus Q4, which would be the first quarterly decline since the COVID lockdowns.

Industrial production rose a tepid 0.1% in February but that follows declines of 0.3% and 0.5% in December and January, respectively. We like to follow manufacturing output excluding the auto sector (which is volatile) and that is down 0.9% from a year ago. Not a good sign.

As always, we will be watching the press conference following Wednesday’s meeting for any mention of the Fed looking more closely at the money supply, but we won’t get our hopes up. The M2 measure of money is down 2.0% in the past year, which would not be good for the economy if these figures are accurate and if they continue.

Another key issue is whether the Fed will publicly abandon it’s 2.0% target to make it easier on themselves to achieve their goal. We think that will happen eventually, but that’s several years from now, not soon. The Fed likely thinks it would lose credibility if it announced a higher target for inflation, and could send long-term interest rates spiraling upward; that’s not a risk the Fed would take, particularly in an election year.

Our advice to investors: listen to and watch the Fed but don’t obsess about it. The changes in monetary policy from meeting to meeting don’t matter nearly as much as the productive capacity of the American people.

The attached information was developed by First Trust, an independent third party. The opinions are of the listed authors at First Trust Advisors L.P, and are independent from and not necessarily those of RJFS or Raymond James.  All investments are subject to risk. There is no guarantee that these statements, opinions, or forecasts provided in the attached article will prove to be correct. Individual investor's results will vary. Past performance does not guarantee future results. Forward looking data is subject to change at any time and there is no assurance that projections will be realized. Any information provided is for informational purposes only and does not constitute a recommendation. Investing involves risk and you may incur a profit or loss regardless of strategy selected.

Is the Job Market Really That Strong?

First Trust Monday Morning Outlook

Brian S. Wesbury - Chief Economist

Robert Stein, CFA - Dep. Chief Economist

March 11, 2024

If you only look at the headlines about the monthly payroll report, the job market has looked surprisingly strong in recent months. Nonfarm payrolls rose 275,000 in February, beating the consensus expected 200,000 as well as the average of 229,000 per month in the past year.

But a deeper look at the data makes it look about as fishy as week-old sushi. Now, we’re not alleging some sort of “Deep State” conspiracy, we’ll leave that to others. But reviewing the report in its entirety show the job market is not nearly as strong as the top line payroll readings suggest.

For example, look at the revisions. Payrolls in December and January were revised down by a total of 167,000 (the largest monthly downgrade for any non-shutdown months since late 2008), meaning February was just 108,000 above the original January level. And it was even worse in the private sector, where payroll gains were a paltry 19,000 for the month after netting out revisions for prior months.

What’s odd about these downward revisions is that they seem to happen pretty darn often of late. In 2023, for example, the regular two-month revision process reduced the initial monthly report by 30,000, on average. That ain’t chump change. In the past few decades, negative revisions like this have normally been associated with recessions or the immediate aftermath of recessions.

It's also important to follow civilian employment, an alternative measure of jobs that includes small-business start-ups. On a monthly basis, these figures are volatile, and are affected by estimates of the size of the total population, so take them with a grain of salt. But the trend is important and isn’t anywhere as strong as payrolls. While payrolls are up 2.7 million in the past year, civilian employment is up 0.7 million and the unemployment rate has risen to 3.9%. Moreover, the gain in civilian employment in the past year has all come in part-time work, with a slight loss for full-time jobs.

There may be solid technical reasons for this large gap. The figures are generated by two different surveys (one for employers, the other for households), and maybe the massive influx in immigrants, even if largely illegal, is finding its way into payroll expansion (perhaps with illegal hiring or false documents) in a way not being picked up by the civilian survey. We’re guessing many recent immigrants are not eager to answer surveys sent by the Labor Department.

Notably, among those who do answer the survey, civilian employment among the native-born population is down around 900,000 from a year ago – the first drop since the onset of COVID – versus an increase of about 1.5 million among the foreign-born.

Only time will tell the true underlying health of the labor market. There is no clear signal we’re in a recession, but the patient isn’t looking well. What is clear, is that economic risks abound, and a soft landing is far from guaranteed.

The attached information was developed by First Trust, an independent third party. The opinions are of the listed authors at First Trust Advisors L.P, and are independent from and not necessarily those of RJFS or Raymond James.  All investments are subject to risk. There is no guarantee that these statements, opinions, or forecasts provided in the attached article will prove to be correct. Individual investor's results will vary. Past performance does not guarantee future results. Forward looking data is subject to change at any time and there is no assurance that projections will be realized. Any information provided is for informational purposes only and does not constitute a recommendation. Investing involves risk and you may incur a profit or loss regardless of strategy selected.